Deploying Python Dash app on Heroku with gunicorn
Heroku is not a bad place to host your app, you can create a free account and test your apps on Heroku servers. They have a tutorial how to deploy apps but not everything is crystal clear. Here i will show how to deploy a simple Python app.Its a simple app which takes a dataframe and plots values. I will use a Python Dash with Plotly and instead of Flask server, i will use Gunicorn.
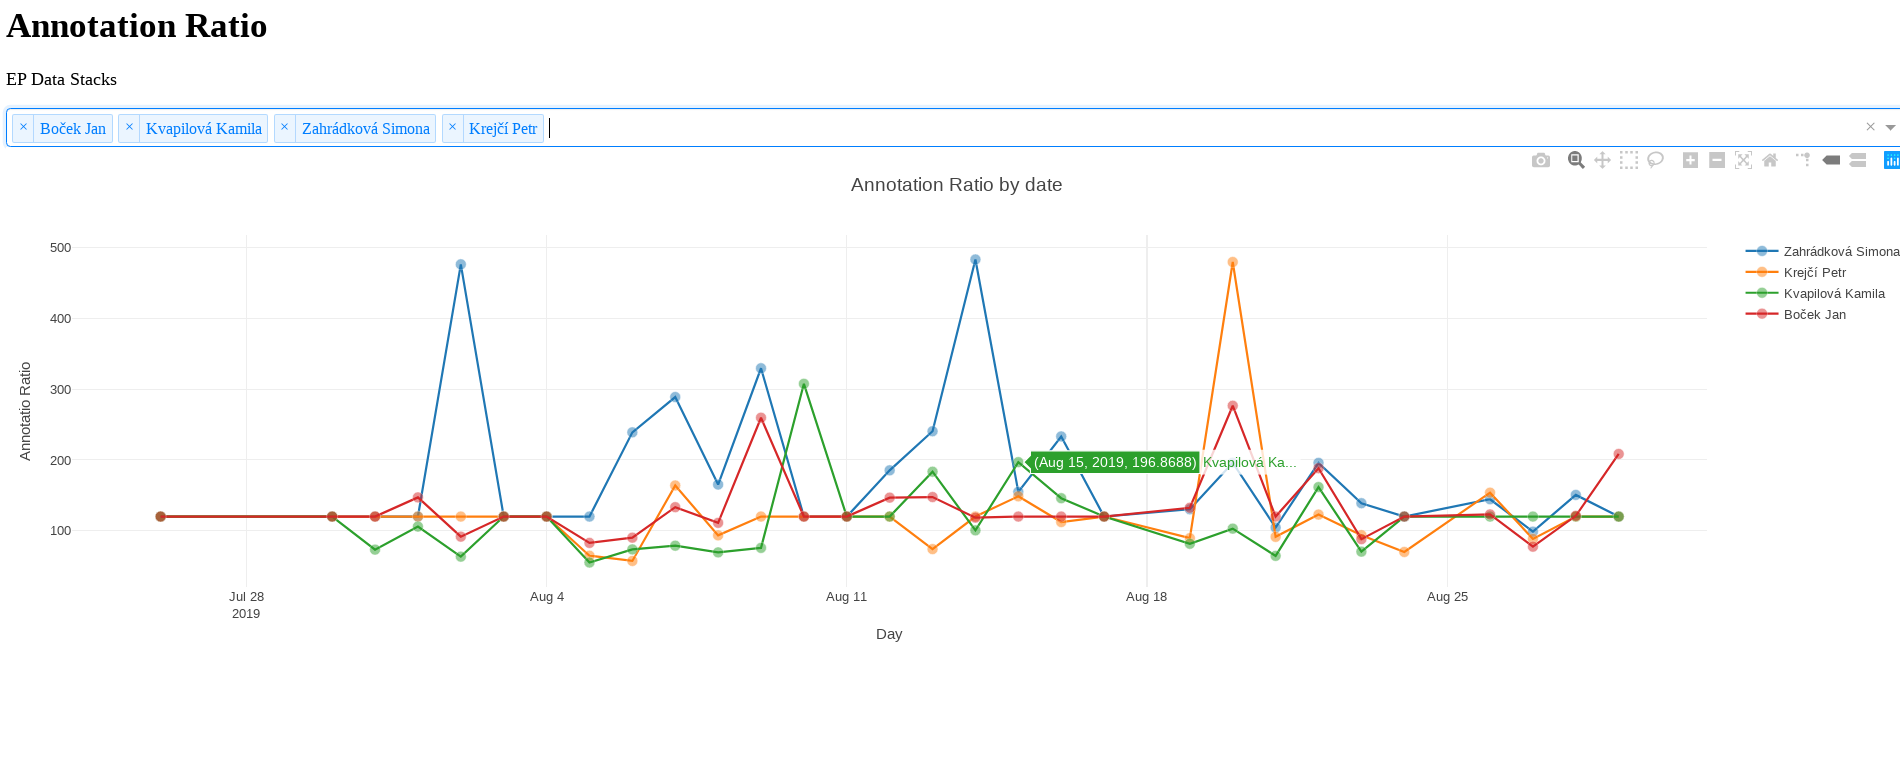
Here is an image of the app, it measures the ratio of annotators and displays the value on chart, where you can compare as many workers as you want.
Here are the imports for the app:
import pandas as pd
import numpy as np
import dash
import dash_html_components as html
import dash_core_components as dcc
import plotly.graph_objs as go
from textwrap import dedent
Inside the apps folder we create folder named data and put our dataset in there. We will read our data in to Pandas:
df = pd.read_excel("data/Efektivity.xlsx")
Then we do all processing we need:
df = df[df["status"] == "Annotatable"]
#Select, rename columns, convert values
df1 = df1.iloc[:, [0,2,3,12,13,32,33,34]]
df1.columns = ["File", "Name", "Date", "Obj", "Frames", "AR", "Dyn1", "AR RB" ]
df1.loc[:,'Dyn1'] = pd.to_numeric(df1["Dyn1"])
df1.loc[:,"Date"] = pd.to_datetime(df1["Date"])
df1["Date"] = df1["Date"].dt.date
Then we start with app code and layout:
app = dash.Dash(__name__)
server = app.server

app.layout = html.Div([
    html.H1('Annotation Ratio'
    ),

    dcc.Markdown("EP Data Stacks"
    ),

    dcc.Dropdown(
        id='annotator-dropdown',
        options=[{'label': i, 'value': i} for i in dfdates.sort_values(by="Name")["Name"].unique()],
        multi=True,
        value=dfdates.sort_values(by="Name")["Name"].unique()[0:4].tolist()
    ),

    dcc.Graph(id='timeseries-graph')
After that we define dependencies:
@app.callback(
    dash.dependencies.Output('timeseries-graph', 'figure'),
    [dash.dependencies.Input('annotator-dropdown', 'value')])
All we have left is to define function to update chart and define actuall plot:
def update_graph(name_values):

    df2 = dfdates.loc[dfdates['Name'].isin(name_values)]

    return {
        'data': [go.Scatter(
            x=df2[df2['Name'] == name]['Date'],
            y= df2[df2["Name"]== name]['AR'],

            mode='lines+markers',
            name=name,
            marker={
                'size': 10,
                'opacity': 0.5,
                'line': {'width': 0.5, 'color': 'white'}
            }
        ) for name in df2.Name.unique()],
        'layout': go.Layout(
            title="Annotation Ratio by date",
            xaxis={'title': 'Day'},
            yaxis={'title': 'Annotatio Ratio'},
            margin={'l': 60, 'b': 50, 't': 80, 'r': 0},
            hovermode='closest'
            # paper_bgcolor='rgba(0,0,0,0)',
            # plot_bgcolor='rgba(0,0,0,0)'
        )
    }
At the end we start the application:
if __name__ == '__main__':
    app.run_server(debug=True)
Deploy
OK that was just a quick description of the application, now we move on to deploy. You need to make a Procfile, where you set the server, here is what worked for me running gunicorn server, you need to define port as variable otherwise it wont work:
web gunicorn plotval:server -b :$PORT
Then fill your requirements.txt, where you put your imports:
pandas
numpy
dash
dash_html_components
dash_core_components
xlrd
gunicorn
Then we start deploying. Open up a terminal and go to the apps folder. Login to heroku an create the app
$ heroku login
$ heroku create
Then initialize the git and add files to it
$ git init
$ git add .
Commit and push files to Heroku server:
$ git commit -m "first commit prototype app"
$ git push heroku master
Fire up one instance and open the app:
$ heroku ps:scale web=1
$ heroku open
And thats it, app is running on Heroku
Check the app out at https://plotval.herokuapp.com/